Hamid Double RSIRSI with Moving Average and Another RSI
This script combines two Relative Strength Index (RSI) indicators with configurable moving averages. It allows traders to track momentum and market strength with adjustable periods for both the RSI and moving averages. The script also allows you to choose different data sources for each RSI, offering flexibility in analysis.
Features:
Two RSIs: One with a shorter period and another with a longer period .
Moving Averages: Each RSI has its own configurable moving average . The moving averages help smooth out the RSI and provide clearer trends.
Customizable Inputs: Adjust the RSI period and the length of the moving averages. You can also choose different sources for each RSI (e.g., close, open, high, low).
Mid Line: A horizontal line at 50, which is commonly used as the neutral level for the RSI. It helps identify whether the RSI is above or below neutral, indicating bullish or bearish conditions.
Overbought and Oversold Levels: Horizontal lines at 70 (overbought) and 30 (oversold) to highlight when the asset might be overbought or oversold according to the RSI.
How it works:
RSI Calculation: The script calculates two RSIs using different lengths
Moving Averages: A Simple Moving Average (SMA) is applied to both RSIs to smooth their values and help identify trends.
Overbought/Oversold Indicators: The script includes horizontal lines at 70 and 30 to show overbought and oversold conditions. The mid line is plotted at 50 to highlight neutral levels.
This indicator is useful for traders who want to compare the behavior of two RSIs over different time periods and use the moving averages to filter out noise. The ability to customize the source data for each RSI makes this script adaptable to different trading strategies.
"Relative Strength Index (RSI) " için komut dosyalarını ara

Multi Oscillator OB/OS Signals v3 - Scope TestIndicator Description: Multi Oscillator OB/OS Signals
Purpose:
The "Multi Oscillator OB/OS Signals" indicator is a TradingView tool designed to help traders identify potential market extremes and momentum shifts by monitoring four popular oscillators simultaneously: RSI, Stochastic RSI, CCI, and MACD. Instead of displaying these oscillators in separate panes, this indicator plots distinct visual symbols directly onto the main price chart whenever specific predefined conditions (typically related to overbought/oversold levels or line crossovers) are met for each oscillator. This provides a consolidated view of potential signals from these different technical tools.
How It Works:
The indicator calculates the values for each of the four oscillators based on user-defined settings (like length periods and price sources) and then checks for specific signal conditions on every bar:
Relative Strength Index (RSI):
It monitors the standard RSI value.
When the RSI crosses above the user-defined Overbought (OB) level (e.g., 70), it plots an "Overbought" symbol (like a downward triangle) above that price bar.
When the RSI crosses below the user-defined Oversold (OS) level (e.g., 30), it plots an "Oversold" symbol (like an upward triangle) below that price bar.
Stochastic RSI:
This works similarly to RSI but is based on the Stochastic calculation applied to the RSI value itself (specifically, the %K line of the Stoch RSI).
When the Stoch RSI's %K line crosses above its Overbought level (e.g., 80), it plots its designated OB symbol (like a downward arrow) above the bar.
When the %K line crosses below its Oversold level (e.g., 20), it plots its OS symbol (like an upward arrow) below the bar.
Commodity Channel Index (CCI):
It tracks the CCI value.
When the CCI crosses above its Overbought level (e.g., +100), it plots its OB symbol (like a square) above the bar.
When the CCI crosses below its Oversold level (e.g., -100), it plots its OS symbol (like a square) below the bar.
Moving Average Convergence Divergence (MACD):
Unlike the others, MACD signals here are not based on fixed OB/OS levels.
It identifies when the main MACD line crosses above its Signal line. This is considered a bullish crossover and is indicated by a specific symbol (like an upward label) plotted below the price bar.
It also identifies when the MACD line crosses below its Signal line. This is a bearish crossover, indicated by a different symbol (like a downward label) plotted above the price bar.
Visualization:
All these signals appear as small, distinct shapes directly on the price chart at the bar where the condition occurred. The shapes, their colors, and their position (above or below the bar) are predefined for each signal type to allow for quick visual identification. Note: In the current version of the underlying code, the size of these shapes is fixed (e.g., tiny) and not user-adjustable via the settings.
Configuration:
Users can access the indicator's settings to customize:
The calculation parameters (Length periods, smoothing, price source) for each individual oscillator (RSI, Stoch RSI, CCI, MACD).
The specific Overbought and Oversold threshold levels for RSI, Stoch RSI, and CCI.
The colors associated with each type of signal (OB, OS, Bullish Cross, Bearish Cross).
(Limitation Note: While settings exist to toggle the visibility of signals for each oscillator individually, due to a technical workaround in the current code, these toggles may not actively prevent the shapes from plotting if the underlying condition is met.)
Alerts:
The indicator itself does not automatically generate pop-up alerts. However, it creates the necessary "Alert Conditions" within TradingView's alert system. This means users can manually set up alerts for any of the specific signals generated by the indicator (e.g., "RSI Overbought Enter," "MACD Bullish Crossover"). When creating an alert, the user selects this indicator, chooses the desired condition from the list provided by the script, and configures the alert actions.
Intended Use:
This indicator aims to provide traders with convenient visual cues for potential over-extension in price (via OB/OS signals) or shifts in momentum (via MACD crossovers) based on multiple standard oscillators. These signals are often used as potential indicators for:
Identifying areas where a trend might be exhausted and prone to a pullback or reversal.
Confirming signals generated by other analysis methods or trading strategies.
Noting shifts in short-term momentum.
Disclaimer: As with any technical indicator, the signals generated should not be taken as direct buy or sell recommendations. They are best used in conjunction with other forms of analysis (price action, trend analysis, volume, fundamental analysis, etc.) and within the framework of a well-defined trading plan that includes risk management. Market conditions can change, and indicator signals can sometimes be false or misleading.

Composite Reversal IndicatorOverview
The "Composite Reversal Indicator" aggregates five technical signals to produce a composite score that ranges from -5 (strongly bearish) to +5 (strongly bullish). These signals come from:
Relative Strength Index (RSI)
Moving Average Convergence Divergence (MACD)
Accumulation/Distribution (A/D)
Volume relative to its moving average
Price proximity to support and resistance levels
Each signal contributes a value of +1 (bullish), -1 (bearish), or 0 (neutral) to the total score. The raw score is plotted as a histogram, and a smoothed version is plotted as a colored line to highlight trends.
Step-by-Step Explanation
1. Customizable Inputs
The indicator starts with user-defined inputs that allow traders to tweak its settings. These inputs include:
RSI: Length (e.g., 14), oversold level (e.g., 30), and overbought level (e.g., 70).
MACD: Fast length (e.g., 12), slow length (e.g., 26), and signal length (e.g., 9).
Volume: Moving average length (e.g., 20) and multipliers for high (e.g., 1.5) and low (e.g., 0.5) volume thresholds.
Price Levels: Period for support and resistance (e.g., 50) and proximity percentage (e.g., 2%).
Score Smoothing: Length for smoothing the score (e.g., 5).
These inputs make the indicator adaptable to different trading styles, assets, or timeframes.
2. Indicator Calculations
The script calculates five key indicators using the input parameters:
RSI: Measures momentum and identifies overbought or oversold conditions.
Formula: rsi = ta.rsi(close, rsi_length)
Example: With a length of 14, it analyzes the past 14 bars of closing prices.
MACD: Tracks trend and momentum using two exponential moving averages (EMAs).
Formula: = ta.macd(close, macd_fast, macd_slow, macd_signal)
Components: MACD line (fast EMA - slow EMA), signal line (EMA of MACD line).
Accumulation/Distribution (A/D): A volume-based indicator showing buying or selling pressure.
Formula: ad = ta.accdist
Reflects cumulative flow based on price and volume.
Volume Moving Average: A simple moving average (SMA) of trading volume.
Formula: vol_ma = ta.sma(volume, vol_ma_length)
Example: A 20-bar SMA smooths volume data.
Support and Resistance Levels: Key price levels based on historical lows and highs.
Formulas:
support = ta.lowest(low, price_level_period)
resistance = ta.highest(high, price_level_period)
Example: Over 50 bars, it finds the lowest low and highest high.
These calculations provide the raw data for generating signals.
3. Signal Generation
Each indicator produces a signal based on specific conditions:
RSI Signal:
+1: RSI < oversold level (e.g., < 30) → potential bullish reversal.
-1: RSI > overbought level (e.g., > 70) → potential bearish reversal.
0: Otherwise.
Logic: Extreme RSI values suggest price may reverse.
MACD Signal:
+1: MACD line > signal line → bullish momentum.
-1: MACD line < signal line → bearish momentum.
0: Equal.
Logic: Crossovers indicate trend shifts.
A/D Signal:
+1: Current A/D > previous A/D → accumulation (bullish).
-1: Current A/D < previous A/D → distribution (bearish).
0: Unchanged.
Logic: Rising A/D shows buying pressure.
Volume Signal:
+1: Volume > high threshold (e.g., 1.5 × volume MA) → strong activity (bullish).
-1: Volume < low threshold (e.g., 0.5 × volume MA) → weak activity (bearish).
0: Otherwise.
Logic: Volume spikes often confirm reversals.
Price Signal:
+1: Close near support (within proximity %, e.g., 2%) → potential bounce.
-1: Close near resistance (within proximity %) → potential rejection.
0: Otherwise.
Logic: Price near key levels signals reversal zones.
4. Composite Score
The raw composite score is the sum of the five signals:
Formula: score = rsi_signal + macd_signal + ad_signal + vol_signal + price_signal
Range: -5 (all signals bearish) to +5 (all signals bullish).
Purpose: Combines multiple perspectives into one number.
5. Smoothed Score
A smoothed version of the score reduces noise:
Formula: score_ma = ta.sma(score, score_ma_length)
Example: With a length of 5, it averages the score over 5 bars.
Purpose: Highlights the trend rather than short-term fluctuations.
6. Visualization
The indicator plots two elements:
Raw Score: A gray histogram showing the composite score per bar.
Style: plot.style_histogram
Color: Gray.
Smoothed Score: A line that changes color:
Green: Score > 0 (bullish).
Red: Score < 0 (bearish).
Gray: Score = 0 (neutral).
Style: plot.style_line, thicker line (e.g., linewidth=2).
These visuals make it easy to spot potential reversals.
How It Works Together
The indicator combines signals from:
RSI: Momentum extremes.
MACD: Trend shifts.
A/D: Buying/selling pressure.
Volume: Confirmation of moves.
Price Levels: Key reversal zones.
By summing these into a composite score, it filters out noise and provides a unified signal. A high positive score (e.g., +3 to +5) suggests a bullish reversal, while a low negative score (e.g., -3 to -5) suggests a bearish reversal. The smoothed score helps traders focus on the trend.
Practical Use
Bullish Reversal: Smoothed score is green and rising → look for buying opportunities.
Bearish Reversal: Smoothed score is red and falling → consider selling or shorting.
Neutral: Score near 0 → wait for clearer signals.
Traders can adjust inputs to suit their strategy, making it versatile for stocks, forex, or crypto.

CHAKRA RISS ENGULFING CANDLESTICK STRATEGYChakra RISS Engulfing Candlestick Strategy
Type: Technical Indicator & Strategy
Platform: TradingView
Script Version: Pine Script v6
Overview:
The Chakra RISS Engulfing Candlestick Strategy combines a momentum-based approach using the Relative Strength Index (RSI) with Engulfing Candlestick Patterns to generate buy and sell signals. The strategy filters trades based on price movement relative to a 50-period Simple Moving Average (SMA), making it a trend-following strategy.
The indicator uses color-coded bars to visually represent market conditions, helping traders easily identify bullish and bearish trends. The strategy is designed to be dynamic, adapting to changing market conditions and filtering out noise using key technical indicators.
How It Works:
RSI-Based Color Conditions:
Green Bars: When the RSI crosses above a specified UpLevel (default: 50), indicating a bullish momentum and signaling potential buy conditions.
Red Bars: When the RSI crosses below a specified DownLevel (default: 50), indicating a bearish momentum and signaling potential sell conditions.
Buy Signal:
Triggered when the following conditions are met:
RSI crosses from below the UpLevel (default: 50) to above it, signaling increasing bullish momentum.
The close price is above the 50-period Simple Moving Average (SMA), confirming an uptrend.
The Buy Signal is plotted below the bar with a green arrow and a "BUY" label.
Sell Signal:
Triggered when the following conditions are met:
RSI crosses from above the DownLevel (default: 50) to below it, signaling increasing bearish momentum.
The close price is below the 50-period Simple Moving Average (SMA), confirming a downtrend.
The Sell Signal is plotted above the bar with a red arrow and a "SELL" label.
Stop Loss and Take Profit:
For long trades (buy signals), the stop loss is placed below the previous bar's low, and the take profit is set at 3% above the entry price.
For short trades (sell signals), the stop loss is placed above the previous bar's high, and the take profit is set at 3% below the entry price.
Dynamic Bar Coloring:
The bar colors change dynamically based on RSI levels:
Green Bars: Indicating a potential uptrend (bullish).
Red Bars: Indicating a potential downtrend (bearish).
These visual cues help traders quickly identify market trends and potential reversals.
Trend Filtering:
The 50-period Simple Moving Average (SMA) is used to filter trades based on the overall market trend:
Buy signals are only considered when the price is above the moving average, indicating an uptrend.
Sell signals are only considered when the price is below the moving average, indicating a downtrend.
Alerting System:
Alerts can be set for both buy and sell signals. These alerts notify traders in real-time when potential trades are generated, allowing them to act promptly.
Alerts can be configured to send notifications through email, SMS, or a webhook for integration with other services like IFTTT or Zapier.
Key Features:
RSI and Moving Average-Based Signals: Combines RSI with a moving average for more accurate trade signals.
Stop Loss and Take Profit: Dynamic risk management with custom stop loss and take profit levels based on previous high and low prices.
Buy and Sell Alerts: Provides real-time alerts when a buy or sell signal is triggered.
Trend Confirmation: Uses the 50-period Simple Moving Average to filter signals and confirm the direction of the trend.
Visual Bar Color Changes: Makes it easy to identify bullish or bearish trends with color-coded bars.
Usage:
This strategy is suitable for traders who prefer a trend-following approach and want to combine momentum indicators (RSI) with price action (Engulfing Candlestick patterns). It is particularly useful in volatile markets where quick identification of trend changes can lead to profitable trades.
Best Used For: Day trading, swing trading, and trend-following strategies.
Timeframes: Works well on various timeframes, from 1-minute charts for scalping to daily charts for swing trading.
Markets: Can be applied to any market with sufficient liquidity (stocks, forex, crypto, etc.).
Settings:
UpLevel: The RSI level above which the market is considered bullish (default: 50).
DownLevel: The RSI level below which the market is considered bearish (default: 50).
SMA Length: The period of the Simple Moving Average used to filter trades (default: 50).
Risk Management: Customizable stop loss and take profit settings based on price action (default: 3% above/below the entry price).

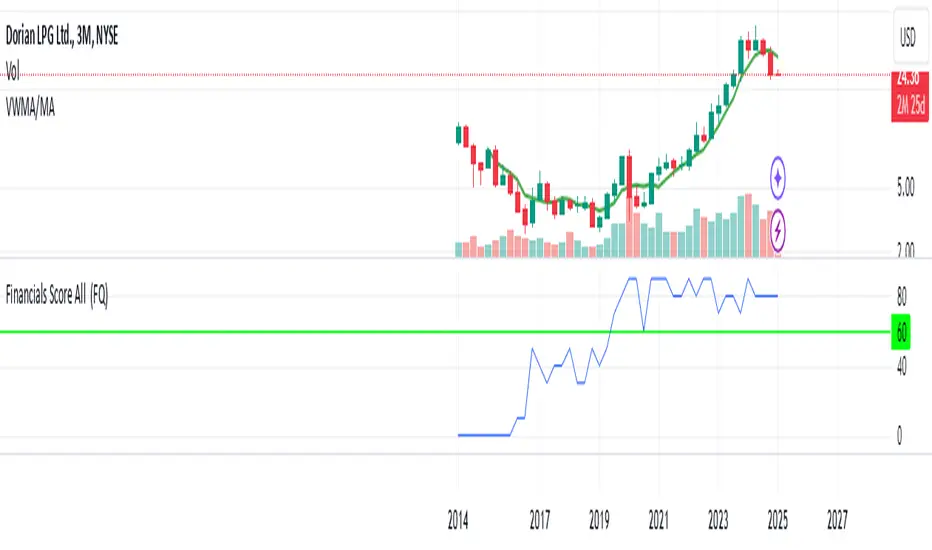
Financials Score All Description of the "Financials Score All" Script
This Pine Script calculates a financial score for a specific stock, based on various financial metrics. The purpose is to provide a comprehensive numerical score that reflects the financial health of the stock. The score is calculated using multiple financial indicators, including profitability, valuation, debt management, and liquidity. Here’s a breakdown of what each part of the script does:
period = input.string('FQ', 'Period', options= )
FQ refers to Quarterly financial data.
FY refers to Fiscal Year financial data.
Financial Metrics:
The script uses various financial metrics to calculate the score. These are obtained via request.financial, which retrieves financial data for the stock from TradingView's database. Below are the metrics used:
opmar (Operating Margin): Measures the company's profitability as a percentage of revenue.
eps (Earnings Per Share): Represents the portion of a company's profit allocated to each outstanding share.
eps_ttm (Earnings Per Share – Trailing Twelve Months): EPS over the most recent 12 months.
pe_ratio (Price-to-Earnings Ratio): A measure of the price investors are willing to pay for a stock relative to its earnings.
pb_ratio (Price-to-Book Ratio): A valuation ratio comparing a company’s market value to its book value.
de_ratio (Debt-to-Equity Ratio): A measure of the company’s financial leverage, showing how much debt it has compared to shareholders' equity.
roe_pb (Return on Equity Adjusted to Book): Measures the company's profitability relative to its book value.
fcf_per_share (Free Cash Flow per Share): Represents the free cash flow available for dividends, debt reduction, or reinvestment, per share.
pfcf_ratio (Price-to-Free-Cash-Flow Ratio): A measure comparing a company’s market value to its free cash flow.
current_ratio (Current Ratio): A liquidity ratio that measures a company's ability to pay short-term obligations with its current assets.
RSI Calculation:
The script calculates the Relative Strength Index (RSI) for the stock using an 8-period lookback:
rsi = ta.rsi(close, 8)
Score Calculation:
The script calculates a total score by adding points based on the values of the financial metrics. Each metric is checked against a condition, and if the condition is met, the score is incremented:
If the Operating Margin (opmar) is greater than 20, the score is incremented by 20 points.
If Earnings Per Share (EPS) is positive, 10 points are added.
If the P/E ratio is between 0 and 20, 10 points are added.
If the P/B ratio is less than 3, 10 points are added.
If the Debt-to-Equity ratio is less than 0.8, 10 points are added.
If the Return on Equity Adjusted to Book is greater than 10, 10 points are added.
If the P/FCF ratio is between 0 and 15, 10 points are added.
If the Current Ratio is greater than 1.61, 10 points are added.
If the RSI is less than 35, 10 points are added.
The score is accumulated based on these conditions and stored in the total_score variable.
Displaying the Total Score:
Finally, the total score is plotted on the chart:
Summary of How It Works:
This script calculates a financial score for a stock using a variety of financial indicators. Each metric has a threshold, and when the stock meets certain criteria (for example, a good operating margin, a healthy debt-to-equity ratio, or a low P/E ratio), points are added to the overall score. The result is a single numerical value that reflects the financial health of the stock.
This score can help traders or investors identify companies with strong financials, or serve as a comparison tool between different stocks based on their financial health.
Generally >60 is the best stocks for med and long term trades
VolWRSI### Description of the `VolWRSI` Script
The `VolWRSI` script is a TradingView Pine Script indicator designed to provide a volume-weighted Relative Strength Index (RSI) combined with abnormal activity detection in both volume and price. This multi-faceted approach aims to enhance trading decisions by identifying potential market conditions influenced by both price movements and trading volume.
#### Key Features
1. **Volume-Weighted RSI Calculation**:
- The core of the script calculates a volume-weighted RSI, which gives more significance to price movements associated with higher volume. This helps traders understand the strength of price movements more accurately.
2. **Abnormal Activity Detection**:
- The script includes calculations for abnormal volume and price changes using standard deviation (SD) multiples. This feature alerts traders to potential unusual activity, which could indicate upcoming volatility or market manipulation.
3. **Market Structure Filtering**:
- The script assesses market structure by identifying pivot highs and lows, allowing for better contextual analysis of price movements. This includes identifying bearish and bullish divergences, which can signal potential reversals.
4. **Color-Coded Signals**:
- The indicator visually represents market conditions using different bar colors for various scenarios, such as bearish divergence, likely price manipulation, and high-risk moves on low volume. This allows traders to quickly assess market conditions at a glance.
5. **Conditional Signal Line**:
- The signal line is displayed only when institutional activity conditions are met, remaining hidden otherwise. This adds an extra layer of filtering to prevent unnecessary signals, focusing only on significant market moves.
6. **Overbought and Oversold Levels**:
- The script defines overbought and oversold thresholds, enhancing the trader's ability to spot potential reversal points. Color gradients help visually distinguish between these critical levels.
7. **Alerts**:
- The script includes customizable alert conditions for various market signals, including abnormal volume spikes and RSI crossings over specific thresholds. This keeps traders informed in real-time, enhancing their ability to act promptly.
#### Benefits of Using the `VolWRSI` Script
- **Enhanced Decision-Making**: By integrating volume into the RSI calculation, the script helps traders make more informed decisions based on the strength of price movements rather than price alone.
- **Early Detection of Market Manipulation**: The abnormal activity detection can help traders identify potentially manipulative market behavior, allowing them to act or adjust their strategies accordingly.
- **Visual Clarity**: The use of color-coding and graphical elements (such as shapes and fills) provides clear visual cues about market conditions, which can be especially beneficial for traders who rely on quick visual assessments.
- **Risk Management**: The identification of high-risk low-volume moves helps traders manage their exposure better, potentially avoiding trades that may lead to unfavorable outcomes.
- **Reduced Noise with Institutional Activity Filtering**: The conditional signal line only plots when institutional activity conditions are detected, providing higher confidence in signals by excluding lower-conviction setups.
- **Customization**: With adjustable parameters for length, thresholds, and colors, traders can tailor the script to their specific trading styles and preferences.
Overall, the `VolWRSI` script combines technical analysis tools in a coherent framework, aiming to provide traders with deeper insights into market dynamics and higher-quality trade signals, potentially leading to more profitable trading decisions.

RSI - EMA - WMA ( Phat-Truong )Indicator: RSI ( EMA - WMA )
This indicator, named "RSI ( EMA - WMA )", is a versatile tool designed to provide insights into market momentum and trend strength by combining multiple technical indicators.
The Relative Strength Index (RSI) is a popular momentum oscillator used to measure the speed and change of price movements. In this indicator, RSI is plotted alongside its Exponential Moving Average (EMA) and Weighted Moving Average (WMA). EMA and WMA are smoothing techniques applied to RSI to help identify trends more clearly.
Key features of this indicator include:
RSI: The main RSI line is plotted on the chart, offering insights into overbought and oversold conditions.
EMA of RSI: The Exponential Moving Average of RSI smooths out short-term fluctuations, aiding in trend identification.
WMA of RSI: The Weighted Moving Average of RSI gives more weight to recent data points, providing a faster response to price changes.
Additionally, this indicator marks specific RSI levels considered as bullish and bearish trends, helping traders identify potential entry or exit points based on market sentiment.
By combining these technical indicators, traders can gain a comprehensive understanding of market dynamics, helping them make more informed trading decisions.

RSI from Rolling VWAP [CHE]Introducing the RSI from Rolling VWAP Indicator
Elevate your trading strategy with the RSI from Rolling VWAP —a cutting-edge indicator designed to provide unparalleled insights and enhance your decision-making on TradingView. This advanced tool seamlessly integrates the Relative Strength Index (RSI) with a Rolling Volume-Weighted Average Price (VWAP) to deliver precise and actionable trading signals.
Why Choose RSI from Rolling VWAP ?
- Clear Trend Detection: Our enhanced algorithms ensure accurate identification of bullish and bearish trends, allowing you to capitalize on market movements with confidence.
- Customizable Time Settings: Tailor the time window in days, hours, and minutes to align perfectly with your unique trading strategy and market conditions.
- Flexible Moving Averages: Select from a variety of moving average types—including SMA, EMA, WMA, and more—to smooth the RSI, providing clearer trend analysis and reducing market noise.
- Threshold Alerts: Define upper and lower RSI thresholds to effortlessly spot overbought or oversold conditions, enabling timely and informed trading decisions.
- Visual Enhancements: Enjoy a visually intuitive interface with color-coded RSI lines, moving averages, and background fills that make interpreting market data straightforward and efficient.
- Automatic Signal Labels: Receive immediate bullish and bearish labels directly on your chart, signaling potential trading opportunities without the need for constant monitoring.
Key Features
- Inspired by Proven Tools: Building upon the robust foundation of TradingView's Rolling VWAP, our indicator offers enhanced functionality and greater precision.
- Volume-Weighted Insights: By incorporating volume into the VWAP calculation, gain a deeper understanding of price movements and market strength.
- User-Friendly Configuration: Easily adjust settings to match your trading preferences, whether you're a novice trader or an experienced professional.
- Hypothesis-Driven Analysis: Utilize hypothetical results to backtest strategies, understanding that past performance does not guarantee future outcomes.
How It Works
1. Data Integration: Utilizes the `hlc3` (average of high, low, and close) as the default data source, with customization options available to suit your trading needs.
2. Dynamic Time Window: Automatically calculates the optimal time window based on an auto timeframe or allows for fixed time periods, ensuring flexibility and adaptability.
3. Rolling VWAP Calculation: Accurately computes the Rolling VWAP by balancing price and volume over the specified time window, providing a reliable benchmark for price action.
4. RSI Analysis: Measures momentum through RSI based on Rolling VWAP changes, smoothed with your chosen moving average for enhanced trend clarity.
5. Actionable Signals: Detects and labels bullish and bearish conditions when RSI crosses predefined thresholds, offering clear indicators for potential market entries and exits.
Seamless Integration with Your TradingView Experience
Adding the RSI from Rolling VWAP to your TradingView charts is straightforward:
1. Add to Chart: Simply copy the Pine Script code into TradingView's Pine Editor and apply it to your desired chart.
2. Customize Settings: Adjust the Source Settings, Time Settings, RSI Settings, MA Settings, and Color Settings to align with your trading strategy.
3. Monitor Signals: Watch for RSI crossings above or below your set thresholds, accompanied by clear labels indicating bullish or bearish trends.
4. Optimize Your Trades: Leverage the visual and analytical strengths of the indicator to make informed buy or sell decisions, maximizing your trading potential.
Disclaimer:
The content provided, including all code and materials, is strictly for educational and informational purposes only. It is not intended as, and should not be interpreted as, financial advice, a recommendation to buy or sell any financial instrument, or an offer of any financial product or service. All strategies, tools, and examples discussed are provided for illustrative purposes to demonstrate coding techniques and the functionality of Pine Script within a trading context.
Any results from strategies or tools provided are hypothetical, and past performance is not indicative of future results. Trading and investing involve high risk, including the potential loss of principal, and may not be suitable for all individuals. Before making any trading decisions, please consult with a qualified financial professional to understand the risks involved.
By using this script, you acknowledge and agree that any trading decisions are made solely at your discretion and risk.
Get Started Today
Transform your trading approach with the RSI from Rolling VWAP indicator. Experience the synergy of momentum and volume-based analysis, and unlock the potential for more accurate and profitable trades.
Download now and take the first step towards a more informed and strategic trading journey!
For further inquiries or support, feel free to contact
Best regards
Chervolino
Inspired by the acclaimed Rolling VWAP by TradingView

XAU/USD Strategy with Correct ADX and Bollinger Bands Fill1. *Indicators Used*:
- *Exponential Moving Averages (EMAs)*: Two EMAs (20-period and 50-period) are used to identify the trend direction and potential entry points based on crossovers.
- *Relative Strength Index (RSI)*: A momentum oscillator that measures the speed and change of price movements. It identifies overbought and oversold conditions.
- *Bollinger Bands*: These consist of a middle line (simple moving average) and two outer bands (standard deviations away from the middle). They help to identify price volatility and potential reversal points.
- *Average Directional Index (ADX)*: This indicator quantifies trend strength. It's derived from the Directional Movement Index (DMI) and helps confirm the presence of a strong trend.
- *Average True Range (ATR)*: Used to calculate position size based on volatility, ensuring that trades align with the trader's risk tolerance.
2. *Entry Conditions*:
- *Long Entry*:
- The 20 EMA crosses above the 50 EMA (indicating a potential bullish trend).
- The RSI is below the oversold level (30), suggesting the asset may be undervalued.
- The price is below the lower Bollinger Band, indicating potential price reversal.
- The ADX is above a specified threshold (25), confirming that there is sufficient trend strength.
- *Short Entry*:
- The 20 EMA crosses below the 50 EMA (indicating a potential bearish trend).
- The RSI is above the overbought level (70), suggesting the asset may be overvalued.
- The price is above the upper Bollinger Band, indicating potential price reversal.
- The ADX is above the specified threshold (25), confirming trend strength.
3. *Position Sizing*:
- The script calculates the position size dynamically based on the trader's risk per trade (expressed as a percentage of the total capital) and the ATR. This ensures that the trader does not risk more than the specified percentage on any single trade, adjusting the position size according to market volatility.
4. *Exit Conditions*:
- The strategy uses a trailing stop-loss mechanism to secure profits as the price moves in the trader's favor. The trailing stop is set at a percentage (1.5% by default) below the highest price reached since entry for long positions and above the lowest price for short positions.
- Additionally, if the RSI crosses back above the overbought level while in a long position or below the oversold level while in a short position, the position is closed to prevent losses.
5. *Alerts*:
- Alerts are set to notify the trader when a buy or sell condition is met based on the strategy's rules. This allows for timely execution of trades.
### Summary
This strategy aims to capture significant price movements in the XAU/USD market by combining trend-following (EMAs, ADX) and momentum indicators (RSI, Bollinger Bands). The dynamic position sizing based on ATR helps manage risk effectively. By implementing trailing stops and alert mechanisms, the strategy enhances the trader's ability to act quickly on opportunities while mitigating potential losses.

Risk Management Calculator with Fees and Take Profit [CHE]Risk Management Calculator with Fees and Take Profit
Welcome to the Risk Management Calculator with Fees and Take Profit script! This powerful tool is designed to help traders manage their risk effectively, calculate leverage, and set take profit targets. The script is inspired by and builds upon the ideas from the following TradingView script: ().
This script is inspired by and builds upon the ideas from the following TradingView script:
Features
1. Portfolio Size Input: Enter the size of your portfolio to accurately calculate your risk and leverage.
2. Max Loss Percent Input: Specify the maximum percentage of your portfolio that you are willing to risk on a single trade.
3. Max Leverage Input: Set the maximum leverage you are comfortable using.
4. Trading Fee Input: Include trading fees in your calculations to get a more realistic view of your potential losses and gains.
5. ATR Settings: Configure the ATR period and multiplier to calculate your stop loss and take profit levels.
6. RSI Settings: Adjust the RSI period for trend analysis.
How to Use
Portfolio Size
- Description: This is the total value of your trading account.
- Input: `portfolioSize`
- Default Value: 100
- Minimum Value: 0.001
Max Loss Percent
- Description: The maximum percentage of your portfolio you are willing to lose on a single trade.
- Input: `maxLossPercent`
- Default Value: 3%
- Range: 0.1% to 100%
Max Leverage
- Description: The maximum leverage you wish to use.
- Input: `maxLeverage`
- Default Value: 125
- Range: 1 to 125
Trading Fee
- Description: The fee percentage you pay per trade.
- Input: `feeRate`
- Default Value: 1%
- Range: 0% to 10%
ATR Settings
- ATR Period: Number of bars used to calculate the Average True Range.
- Input: `atrPeriod`
- Default Value: 5
- ATR Multiplier: Multiplier for ATR to set stop loss levels.
- Input: `atrMultiplier`
- Default Value: 2.0
Take Profit Multiplier
- Description: Multiplier for ATR to set take profit levels.
- Input: `takeProfitMultiplier`
- Default Value: 2.0
RSI Settings
- RSI Period: Period for the RSI calculation.
- Input: `rsiPeriod`
- Default Value: 14
Dashboard
The script includes a customizable dashboard that displays the following information:
- Portfolio Size
- Maximum Loss Amount
- Entry Price
- Stop Loss Price
- Stop Loss Percentage
- Calculated Leverage
- Order Value
- Order Quantity
- Trend Direction
- Adjusted Maximum Loss Percentage
- Take Profit Price
Dashboard Settings
- Location: Choose the position of the dashboard on the chart.
- Options: 'Top Right', 'Bottom Right', 'Top Left', 'Bottom Left'
- Size: Adjust the size of the dashboard text.
- Options: 'Tiny', 'Small', 'Normal', 'Large'
- Text/Frame Color: Set the color for the text and frame of the dashboard.
Underlying Principles and Assumptions
Leverage Calculation
The leverage calculation is fundamental to risk management in trading. It ensures that the risk per trade does not exceed a specified percentage of the portfolio. This calculation takes into account the potential loss from the entry price to the stop loss level, adjusted for trading fees. By dividing the maximum acceptable loss by the total potential loss (including fees), we derive a leverage that limits the exposure per trade. This approach helps traders avoid over-leveraging, which can lead to significant losses.
ATR and Stop Loss
The Average True Range (ATR) is used to set stop loss levels because it measures market volatility. A higher ATR indicates more volatility, which means wider stop losses are needed to avoid being prematurely stopped out by normal market fluctuations. By using an ATR multiplier, the stop loss is dynamically adjusted based on current market conditions, providing a more robust risk management strategy.
Take Profit Calculation
The take profit level is calculated as a multiple of the ATR, ensuring that it is set at a realistic level relative to market volatility. This method aims to capture significant price movements while avoiding the noise of smaller fluctuations. Setting take profit targets this way helps in locking in profits when the market moves favorably.
RSI for Trend Confirmation
The Relative Strength Index (RSI) is used to confirm the trend direction. An RSI above 50 typically indicates a bullish trend, while an RSI below 50 indicates a bearish trend. By aligning trades with the prevailing trend, the script increases the probability of successful trades. This trend confirmation helps in making informed decisions about leverage and position sizing.
Risk Color Coding
The script uses color coding to visually indicate the risk level and trend direction. Green indicates a favorable condition for long trades, red for short trades, and gray for neutral conditions. This intuitive color coding aids in quickly assessing the market conditions and making timely trading decisions.
Conclusion
This script aims to provide a comprehensive risk management tool for traders. By integrating portfolio size, leverage, fees, ATR, and RSI, it helps in making informed trading decisions. We hope you find this tool useful in your trading journey.
Happy Trading!

Volume-Enhanced Momentum Moving Average (VEMMA)Volume-Enhanced Momentum Moving Average (VEMMA)
Overview:
The Volume-Enhanced Momentum Moving Average (VEMMA) helps you spot market trends by combining momentum and volume as a moving average. This unique moving average adjusts itself based on the strength and activity of the market, giving you a clearer picture of what’s happening.
How It Works:
1. Key Settings (all of these are adjustable in the settings panel of the indicator):
◦ Base Length: Looks back over the last 50 days by default.
◦ Momentum Length: Uses the past 14 days to measure market strength.
◦ Volume Length: Uses the past 30 days to average trading volume.
◦ High/Low Thresholds: Considers RSI values above 70 as high momentum and below 30 as low momentum.
2. Momentum and Volume:
◦ Momentum: Calculated using the Relative Strength Index (RSI) to see if the market is gaining or losing strength.
◦ Volume: Average trading volume is calculated over the last 30 days to gauge trading activity.
3. VEMMA Calculation:
◦ For each of the past 50 days:
▪ Check Momentum: If RSI > 70, it’s high momentum; if RSI < 30, it’s low.
▪ Weight by Volume: High momentum days with high volume get more weight; low momentum days get less.
▪ Combine: Multiply the closing price by this weight and sum it up.
◦ Average: Divide the total by 50 to get the VEMMA value.
4. Visuals:
◦ Lines: Two lines, VEMMA1 (blue) and VEMMA2 (orange), show the adjusted moving averages.
◦ Colours: Background colors help you quickly spot high (green) and low (red) momentum periods.
How to Use:
• Spot Trends: Rising VEMMA lines suggest an uptrend; falling lines suggest a downtrend.
• Confirm Signals: When both VEMMA1 and VEMMA2 move together, it indicates a strong trend.
• Identify Reversals: Watch for background color changes from green to red or vice versa to catch potential trend reversals.
If the market has been strong and active, the VEMMA line will rise more sharply. If the market is weak and quiet, the line will be smoother.
Benefits:
• Integrated View: Combines market strength and trading activity for a fuller picture.
• Responsive: Adapts to significant market changes, highlighting key movements.
• Easy to Read: Clear visuals with color-coded backgrounds make interpretation simple.
Remember, just like any other indicator, this is not supposed to be used alone. Use it as part of your greater trading strategy. I do however believe it works exceptionally well for finding longer term trends early. The default VEMMA settings work very well as replacement for the EMA 200. Try it and see how it goes. Play around with the settings. Feedback appreciated.

Wall Street Cheat Sheet IndicatorThe Wall Street Cheat Sheet Indicator is a unique tool designed to help traders identify the psychological stages of the market cycle based on the well-known Wall Street Cheat Sheet. This indicator integrates moving averages and RSI to dynamically label market stages, providing clear visual cues on the chart.
Key Features:
Dynamic Stage Identification: The indicator automatically detects and labels market stages such as Disbelief, Hope, Optimism, Belief, Thrill, Euphoria, Complacency, Anxiety, Denial, Panic, Capitulation, Anger, and Depression. These stages are derived from the emotional phases of market participants, helping traders anticipate market movements.
Technical Indicators: The script uses two key technical indicators:
200-day Simple Moving Average (SMA): Helps identify long-term market trends.
50-day Simple Moving Average (SMA): Aids in recognizing medium-term trends.
Relative Strength Index (RSI): Assesses the momentum and potential reversal points based on overbought and oversold conditions.
Clear Visual Labels: The current market stage is displayed directly on the chart, making it easy to spot trends and potential turning points.
Usefulness:
This indicator is not just a simple mashup of existing tools. It uniquely combines the concept of market psychology with practical technical analysis tools (moving averages and RSI). By labeling the psychological stages of the market cycle, it provides traders with a deeper understanding of market sentiment and potential future movements.
How It Works:
Disbelief: Detected when the price is below the 200-day SMA and RSI is in the oversold territory, indicating a potential bottom.
Hope: Triggered when the price crosses above the 50-day SMA, with RSI starting to rise but still below 50, suggesting an early uptrend.
Optimism: Occurs when the price is above the 50-day SMA and RSI is between 50 and 70, indicating a strengthening trend.
Belief: When the price is well above the 50-day SMA and RSI is between 70 and 80, showing strong bullish momentum.
Thrill and Euphoria: Identified when RSI exceeds 80, indicating overbought conditions and potential for a peak.
Complacency to Depression: These stages are identified based on price corrections and drops relative to moving averages and declining RSI values.
Best Practices:
High-Time Frame Focus: This indicator works best on high-time frame charts, specifically the 1-week Bitcoin (BTCUSDT) chart. The longer time frame provides a clearer picture of the overall market cycle and reduces noise.
Trend Confirmation: Use in conjunction with other technical analysis tools such as trendlines, Fibonacci retracement levels, and support/resistance zones for more robust trading strategies.
How to Use:
Add the Indicator: Apply the Wall Street Cheat Sheet Indicator to your TradingView chart.
Analyze Market Stages: Observe the dynamic labels indicating the current stage of the market cycle.
Make Informed Decisions: Use the insights from the indicator to time your entries and exits, aligning your trades with the market sentiment.
This indicator is a valuable tool for traders looking to understand market psychology and make informed trading decisions based on the stages of the market cycle.

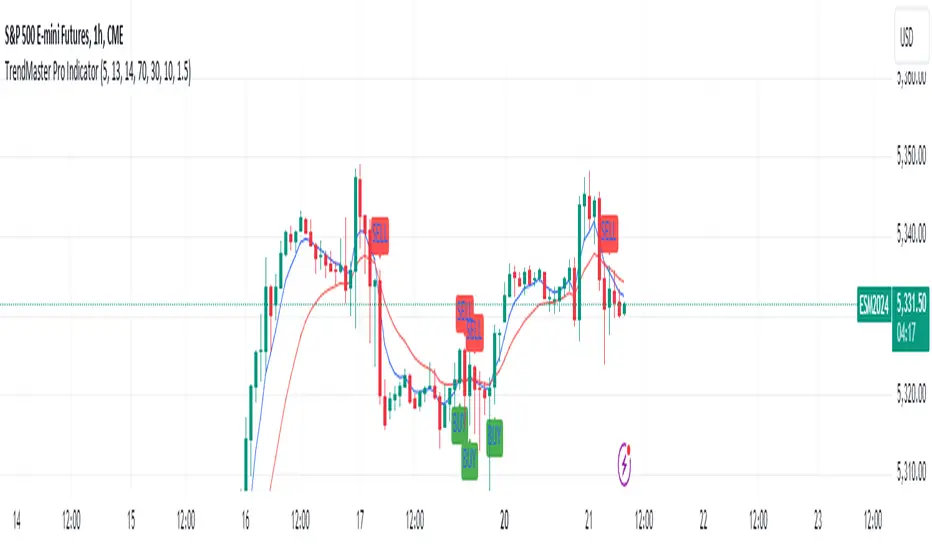
TrendMaster Pro IndicatorThe TrendMaster Pro Indicator is an advanced tool designed to assist traders in identifying potential buy and sell signals by leveraging a combination of exponential moving averages (EMAs), the relative strength index (RSI), and a custom volatility filter. This powerful indicator is suitable for traders of all levels and can be applied to various markets and timeframes, offering flexibility and reliability in trading decisions.
Key Features:
EMA Crossover Detection:
Utilizes a 5-period (short) and 13-period (long) EMA crossover to detect trend changes.
A bullish signal is generated when the 5 EMA crosses above the 13 EMA, indicating an upward trend.
A bearish signal is generated when the 5 EMA crosses below the 13 EMA, indicating a downward trend.
RSI Confirmation:
Incorporates a 14-period RSI to confirm the strength of detected trends.
A buy signal is validated when the RSI is above 50, indicating bullish momentum.
A sell signal is validated when the RSI is below 50, indicating bearish momentum.
Custom Volatility Filter:
Employs a volatility filter based on the standard deviation of closing prices over a specified period (default is 10 periods).
Ensures signals are only generated during periods of significant market movement, reducing noise and false signals.
The volatility threshold can be adjusted to suit different market conditions and trading styles.
How It Works:
EMA Crossover:
The TrendMaster Pro Indicator continuously monitors the crossover between the 5-period and 13-period EMAs.
A crossover event triggers the initial signal, suggesting a potential change in trend direction.
RSI Confirmation:
After an EMA crossover, the indicator checks the 14-period RSI value to confirm the trend's strength.
This confirmation step helps filter out weak or unreliable signals, ensuring only high-probability trades are considered.
Volatility Filter:
The indicator calculates the standard deviation of closing prices over the selected period to measure market volatility.
Signals are only generated if the volatility exceeds the user-defined threshold, ensuring that trades are made in active and dynamic market conditions.
How to Use:
Apply the Indicator:
Add the TrendMaster Pro Indicator to your trading chart via the TradingView platform.
Customize the EMA, RSI, and volatility settings according to your trading preferences and the specific market conditions.
Interpret Buy and Sell Signals:
Buy Signal: Look for a buy signal when the 5 EMA crosses above the 13 EMA, the RSI is above 50, and volatility exceeds the threshold. This combination indicates a strong bullish trend.
Sell Signal: Look for a sell signal when the 5 EMA crosses below the 13 EMA, the RSI is below 50, and volatility exceeds the threshold. This combination indicates a strong bearish trend.
Adjust Settings:
The default settings can be fine-tuned to match your trading strategy. Adjust the EMA lengths, RSI period, and volatility threshold to optimize the indicator for different assets and timeframes.
Unique Features:
Comprehensive Trend Detection: Combines multiple indicators (EMAs, RSI, volatility) to provide a holistic view of market trends.
Customizable: Easily adjustable settings allow traders to tailor the indicator to their specific needs and preferences.
Noise Reduction: The volatility filter ensures signals are generated only during significant market movements, improving signal accuracy and reliability.
Conclusion:
The TrendMaster Pro Indicator is a versatile and powerful tool that can enhance your trading strategy by providing clear and reliable buy and sell signals. Whether you are a day trader or a swing trader, this indicator can help you navigate the markets with confidence and precision. Add the TrendMaster Pro Indicator to your toolkit today and experience a new level of trading efficiency and effectiveness.
RSI EMA WMA (hieuhn)Indicator: RSI & EMA & WMA (14-9-45)
This indicator, named "RSI & EMA & WMA", is a versatile tool designed to provide insights into market momentum and trend strength by combining multiple technical indicators.
The Relative Strength Index (RSI) is a popular momentum oscillator used to measure the speed and change of price movements. In this indicator, RSI is plotted alongside its Exponential Moving Average (EMA) and Weighted Moving Average (WMA). EMA and WMA are smoothing techniques applied to RSI to help identify trends more clearly.
Key features of this indicator include:
RSI: The main RSI line is plotted on the chart, offering insights into overbought and oversold conditions.
EMA of RSI: The Exponential Moving Average of RSI smooths out short-term fluctuations, aiding in trend identification.
WMA of RSI: The Weighted Moving Average of RSI gives more weight to recent data points, providing a faster response to price changes.
Additionally, this indicator marks specific RSI levels considered as bullish and bearish trends, helping traders identify potential entry or exit points based on market sentiment.
By combining these technical indicators, traders can gain a comprehensive understanding of market dynamics, helping them make more informed trading decisions.

Multi-Timeframe Momentum Indicator [Ox_kali]The Multi-Timeframe Momentum Indicator is a trend analysis tool designed to examine market momentum across various timeframes on a single chart. Utilizing the Relative Strength Index (RSI) to assess the market’s strength and direction, this indicator offers a multidimensional perspective on current trends, enriching technical analysis with a deeper understanding of price movements. Other oscillators, such as the MACD and StochRSI, will be integrated in future updates.
Regarding the operation with the RSI: when its value is below 50 for a given period, the trend is considered bearish. Conversely, a value above 50 indicates a bullish trend. The indicator goes beyond the isolated analysis of each period by calculating an average of the displayed trends, based on user preferences. This average, ranging from “Strong Down” to “Strong Up,” reflects the percentage of periods indicating a bullish or bearish trend, thus providing a precise overview of the overall market condition.
Key Features:
Multi-Timeframe Analysis : Allows RSI analysis across multiple timeframes, offering an overview of market dynamics.
Advanced Customization : Includes options to adjust the RSI period, the RSI trend threshold, and more.
Color and Transparency Options : Offers color styles for bullish and bearish trends, as well as adjustable transparency levels for personalized visualization.
Average Trend Display : Calculates and displays the average trend based on activated timeframes, providing a quick summary of the current market state.
Flexible Table Positioning : Allows users to choose the indicator’s display location on the chart for seamless integration.
List of Parameters:
RSI Period : Defines the RSI period for calculation.
RSI Up/Down Threshold: Threshold for determining bullish or bearish trends of the RSI.
Table Position: Location of the indicator’s display on the chart.
Color Style : Selection of the color style for the indicator.
Strong Down/Up Color (User) : Customization of colors for strong market movements.
Table TF Transparency : Adjustment of the transparency level for the timeframe table.
Show X Minute/Hour/Day/Week Trend : Activation of the RSI display for specific timeframes.
Show AVG : Option to display or not the calculated average trend.
the Multi-Timeframe Momentum Indicator , stands as a comprehensive tool for market trend analysis across various timeframes, leveraging the RSI for in-depth market insights. With the promise of future updates including the integration of additional oscillators like the MACD and StochRSI, this indicator is set to offer even more robust analysis capabilities.
Please note that the MTF-Momentum is not a guarantee of future market performance and should be used in conjunction with proper risk management. Always ensure that you have a thorough understanding of the indicator’s methodology and its limitations before making any investment decisions. Additionally, past performance is not indicative of future results.

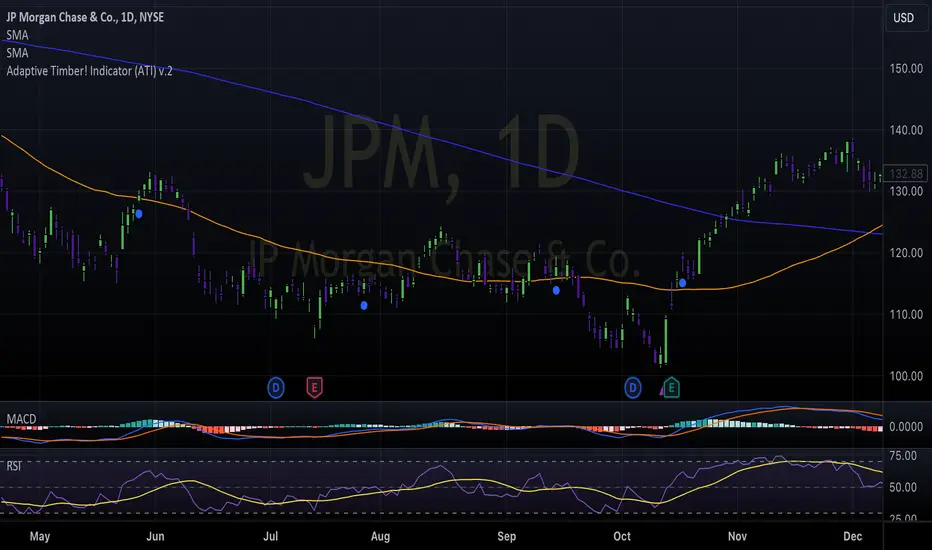
Adaptive Timber! Indicator (ATI)The Adaptive Timber! Indicator (ATI) is a powerful tool designed to identify potential overbought conditions and generate reversal signals in financial markets. It combines multiple technical indicators and market conditions to provide a comprehensive assessment of the likelihood of a price reversal.
How it works:
The ATI uses a combination of the Relative Strength Index (RSI), Moving Average Convergence Divergence (MACD), momentum, and volume to detect overbought conditions and potential reversals. The indicator adapts to the current timeframe, adjusting its parameters accordingly to provide more accurate signals.
Key components:
RSI: The ATI uses the RSI to determine overbought conditions. When the RSI exceeds a specified reversal threshold, it indicates a potential overbought state.
MACD: The indicator monitors the MACD line and signal line to identify moments when they are close to crossing, suggesting a potential trend reversal.
Momentum: The ATI checks if the momentum is increasing, providing confirmation of a potential reversal.
Volume: It analyzes volume to confirm the strength of the reversal signal. A decrease in volume along with overbought conditions adds confidence to the reversal indication.
Timeframe Adaptability: The indicator automatically adjusts its parameters based on the current timeframe, ensuring optimal performance across different time horizons.
How to use:
When the ATI identifies a potential reversal, it displays a colored triangle above the price bars. The color of the triangle represents the strength of the reversal signal: red for a strong signal, orange for a moderate signal, and yellow for a weak signal. Additionally, the indicator plots purple triangles below the price bars as an early warning signal for potential trend reversals.
Traders can use these visual cues along with other technical analysis techniques and risk management strategies to make informed trading decisions. The ATI can be particularly useful for identifying potential short-selling opportunities or for determining exit points in existing long positions.
Creators:
The Adaptive Timber! Indicator (ATI) is the result of a collaborative effort led by Claude , an AI assistant with expertise in financial analysis and programming. The development of the ATI was made possible through the valuable contributions and insights from GPT4 , an advanced language model, Clay , a skilled trader, and Pi AI , Clay's trading assistant.
Claude played a crucial role in designing and implementing the indicator's algorithm, ensuring its robustness and adaptability across different timeframes. GPT4 provided guidance and suggestions for refining the indicator's logic and optimizing its performance. Clay and Pi AI offered their trading expertise and real-world experience to help shape the indicator's functionality and usability.
We would like to express our gratitude to all the members of our trading team for their dedication and hard work in bringing the Adaptive Timber! Indicator to life. We wish all traders the best of luck in their trading endeavors and hope that the ATI will be a valuable addition to their technical analysis toolkit, empowering them to make more informed and profitable trading decisions.
Multi-Timeframe RSI Tracker by Ox_kaliThis script, is trend Tracker that serves as an analytical tool for assessing market trends through the lens of the Relative Strength Index (RSI) across multiple timeframes. It caters to individuals who require a detailed examination of market dynamics, leveraging the RSI to gauge the strength and direction of market momentum.
Functionality Overview:
Multi-Timeframe Analysis: The script evaluates the RSI across an array of timeframes, from 1 minute up to 1 week. This diverse range allows for a comprehensive view of market trends, accommodating strategies that span from intraday to long-term analysis.
RSI Trend Interpretation: It utilizes the RSI to determine market trends. Specifically, an RSI value above 50 signals a bullish trend, indicating that positive momentum is prevailing. Conversely, an RSI below 50 suggests a bearish trend, marking a period of negative momentum. This simple yet effective method provides a quick way to assess the market’s direction.
Customization and Flexibility: Users can customize the appearance of trend lines with different colors to distinguish between bullish and bearish trends easily. Furthermore, the script includes options to select which timeframes are displayed, allowing users to tailor the analysis to their specific needs.
Average Trend Indicator: A important feature is the calculation of an average trend across all selected timeframes. This aggregated trend gives a summarized view of the overall market direction, offering an additional layer of insight.
Adjustments and Enhancements:
User-Controlled Settings: Beyond the pre-defined color themes (Normal, Modern, Classic, Robust, Accented, Monochrome), the script introduces a user-defined option for maximum customization. This feature empowers users to set their preferred colors for various trend conditions.
Label Positioning and RSI Period Customization: The script provides inputs for adjusting label positions and setting the RSI period, enabling a personalized and clear charting experience.
Detailed Timeframe Analysis: The inclusion of a wide range of timeframes ensures that users can conduct a detailed examination of market behaviors, facilitating informed decision-making.
Operational Note:
The Multi-Timeframe RSI Tracker is a tool designed to supplement market analysis within a comprehensive trading strategy. It is crucial for users to integrate this tool within a framework that includes risk management and to familiarize themselves with its functionalities through testing and practice. By offering a detailed perspective on market trends through RSI analysis, this script by Ox_kali provides valuable insights, aiding users in navigating the complexities of the financial markets with an informed approach.
Please note that the MTEMA-Tracker is not a guarantee of future market performance and should be used in conjunction with proper risk management. Always ensure that you have a thorough understanding of the indicator’s methodology and its limitations before making any investment decisions. Additionally, past performance is not indicative of future results.

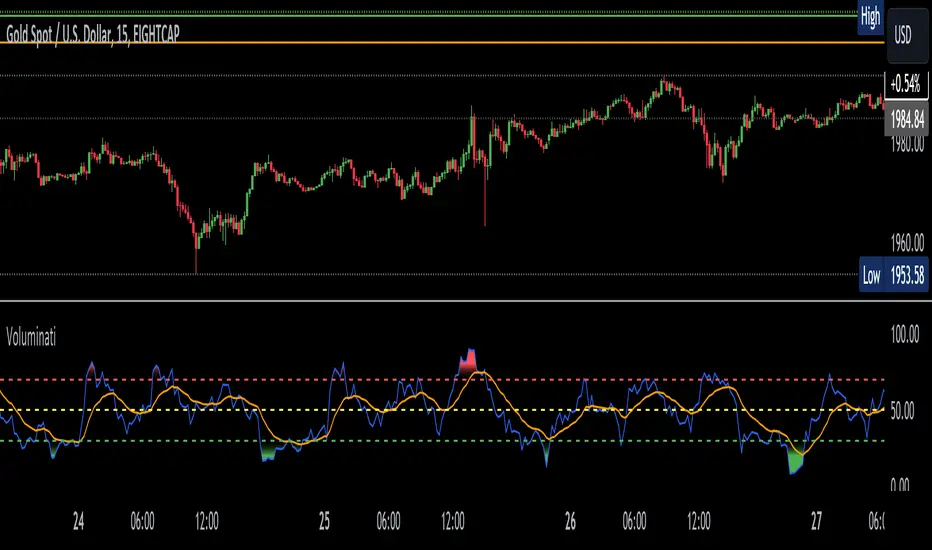
Voluminati: Uncovering Market SecretsVoluminati: Uncovering Market Secrets
Overview:
The Voluminati indicator dives deep into the secrets of trading volume, providing traders with unique insights into the market's strength and direction. This advanced tool visualizes the Relative Strength Index (RSI) of trading volume alongside the traditional RSI of price, presenting an enriched perspective on market dynamics.
Features:
Volume RSI: A unique twist on the traditional RSI, the Volume RSI measures the momentum of trading volume. This can help identify periods of increasing buying or selling pressure.
Traditional RSI: The renowned momentum oscillator that measures the speed and change of price movements. Useful for identifying overbought or oversold conditions.
Moving Averages: Both the Volume RSI and traditional RSI come with optional moving averages. These can be toggled on or off and are customizable in type (SMA or EMA) and length.
Overbought & Oversold Fills: Visual aids that highlight regions where the Volume RSI is in overbought (above 70) or oversold (below 30) territories. These fills help traders quickly identify potential reversal zones.
How to Use:
Look for divergence between the Volume RSI and price, which can indicate potential reversals.
When the Volume RSI moves above 70, it might indicate overbought conditions, and when it moves below 30, it might indicate oversold conditions.
The optional moving averages can be used to identify potential crossover signals or to smooth out the oscillators for a clearer trend view.
Customizations:
Toggle the display of the traditional RSI and its moving average.
Choose the type (SMA/EMA) and length for both the Volume RSI and traditional RSI moving averages.
Note: Like all indicators, the Voluminati is best used in conjunction with other tools and analysis techniques. Always use proper risk management.
RSI-ROC Momentum AlertThis is the RSI-ROC Momentum Alert trading indicator, designed to help traders identify potential buy and sell signals based on the momentum of price movements.
The indicator is based on two technical indicators: the Rate of Change (ROC) and the Relative Strength Index (RSI). The ROC measures the speed of price changes over a given period, while the RSI measures the strength of price movements. By combining these two indicators, this trading indicator aims to provide a comprehensive view of the market momentum.
An RSI below its oversold level, which shows as a green background, in addition to a ROC crossing above its moving average (turns green) signals a buying opportunity.
An RSI above its overbought level, which shows as a red background, in addition to a ROC crossing below its moving average (turns red) signals a selling opportunity.
Traders can use this indicator to identify potential momentum shifts and adjust their trading strategies accordingly.
The ROC component of the indicator uses a user-defined length parameter to calculate the ROC and a simple moving average (SMA) of the ROC. The color of the ROC line changes to green when it is above the ROC SMA and to red when it is below the ROC SMA. The ROC SMA color changes whether it's above or below a value of 0.
The RSI component of the indicator uses a user-defined length parameter to calculate the RSI, and user-defined RSI Low and RSI High values to identify potential buy and sell signals. When the RSI falls below the RSI Low value, a green background color is applied to the chart to indicate a potential buy signal. Conversely, when the RSI rises above the RSI High value, a red background color is applied to the chart to indicate a potential sell signal.
This indicator is intended to be used on any time frame and any asset, and can be customized at will.

RSI Multi Symbol/Time Frame DetectorThis code is an implementation of the Relative Strength Index (RSI) indicator, which is a popular momentum indicator used in technical analysis. The RSI measures the strength of an asset's price action and provides information on whether the asset is overbought or oversold. The code also calculates a moving average of the RSI and allows the user to choose the type of moving average to be calculated (SMA, EMA, SMMA, WMA, or VWMA).
The user can select from different time frames (5, 15, 60, or 240), symbols (SP:SPX, OANDA:EURUSD, or OANDA:NZDUSD), RSI lengths, and moving average types and lengths.
The code starts by defining a function called "ma" for calculating different types of moving averages. This function takes as input the source data for the moving average calculation (the RSI), the length of the moving average, and the type of moving average. The function uses a switch statement to return the appropriate calculation based on the inputted moving average type.
Next, the code calculates the RSI and its moving average. The RSI is calculated using the well-known formula for the RSI, which involves calculating the average gains and losses over a specified period of time and then dividing the average gains by the average losses. The moving average is calculated using the "ma" function defined earlier.
Finally, the code allows the user to choose the symbol and time frame to be used in the RSI calculation, as well as the length of the RSI and the moving average, and the type of moving average. The user can choose from three symbols (SP:SPX, OANDA:EURUSD, OANDA:NZDUSD) and four time frames (5, 15, 60, and 240 minutes). The code then uses the "request.security" function to retrieve the RSI calculation for the selected symbol and time frame.
Note: This code is example for you to use multi timeframe/symbol in your indicator or Strategy , also prevent Repainting Calculation

Bearish Market Indicator V2Definition
Have you ever wonder whether if the stock/index/market is "bearish" ? A Bearish Market Indicator (B.M.I) is not a new concept, the definition is simply 20% lower from the recent (term: short-term, recent: usually within a year, a.k.a 1 year) highs (closing price with in the recent period or within in a year or simply a 52-Week High). It is called “bearish” by definition when the closing price is below 20% from the highest price within the year (52-Week high: Green Line). To visualize the “20%” below the recent highs, there is a plot (line: light yellow color in the middle) called a Bearish Market By Definition Value. For example, the SPX 500 has been in a bearish market which is why there is a purple color highlight over the 52-Week High (green line) since September 21, 2022 because the closing price is below the Bearish Market By Definition Value (light yellow color) or “20% below the recent highs”. Finally, there is a red line under in the graph and it is the lowest price within a year. So when you hear, “this ticker is at a 52-Week Low”, you know what it means.
Line Summary:
Green Color Line = 52-Week High
Yellow Color Line = 20% away from the 52-Week High or Bearish Market By Definition Value
Red Color Line = 52-Week Low
Color Summary:
Red Color = Bad
Saturated Red Color = Very Bad
Purple Color = Bearish (It may look pink: red + purple)
White Color = Less Bad (That’s because there is no certainty only probability)
Green Color = Not too Bad (That’s because there is no certainty only probability)
Now to more complicated Metrics
>> If you do not like the technical indicators, go to the indicator settings, uncheck the tables. Otherwise, please continue reading. <<
Pre-requisites
+ Understand that the indicators are lagging indicators.
+ Using it under “D” or “Day” interval
+ Already Understand: Moving Averages, Stochastic-RSI, RSI, Super Trend and MACD.
+ Please be aware that this might not be compatible with traders!
Indicators
This B.M.I is fused (comprised, combined) with multiple indicators:
- Moving Averages
I would not rely just on the Moving Averages (MA) since it is a lagging indicator. The values are derived by finding the differences with respect to the MAs (between the closing price and with the respect MA).
- Stochastic-RSI
Stochastic and RSI combo with RSI-Color coating. The first value is the rsi-stochastic-k followed by the rsi-stochastic-d both are compartmentalized with “|”.
Parameter:
Numbers > 80 Not Good
Numbers < 20 Is it time? (You can manually verify the lines (k, d) or the values from them)
- Relative Strength Index (RSI)
The first value is the rsi followed by the rsi-ma both are compartmentalized with “|”. It is also coated with RSI-color.
Parameter:
Numbers > 70 Overbought | Color Red
If the RSI > RSI’s MA = Green
If the RSI < RSI’s MA = Red
Numbers < 30 Oversold | Color Red
- Moving Averages Convergence Divergence (MACD)
The first value is the MACD-line followed by the signal-line both are compartmentalized with “|”.
Macd-line > signal line = green
Macd-line < signal line = red
- Supertrend (please look up from the documentation; i can not embed the link)
Think of this way, you’re riding a wave. If the wave is climbing, expect the price to follow.
Direction < 0 = Green
Direction > 0 = Red
- Other Trend similar to supertrend
This is similar to the Super Trend according the some. Imagine you’re drawing a trend line manually within 6 months.
Within the period, the line gets smoothed over and over til the n=9.
> If the closing is less than the 9th value, it implies the trend is slowing down.
Usage
Adjustments
+ Since there are different holidays from different countries, you can change the BMI-Period from the indicator settings “BMI-4khansolo”.
+ You can hide Technical Indicator Tables, it is also under the settings (see above).
> This will show red over the 52-Week high if it tests for positive .
Purpose
Do you like eating the same food over and over? No! I love different food! I also love a variety of indicators. Especially, I love having MULTIPLE indicators presented in one canvas at the same time (personalized).
After spending a lot of time, I want to share my “FOOD” which is made of different ingredients (indicators) with someone who appreciates food! This Makes me a chef isn't it? Yes! Chef!
Questions?
If you have questions or spotted errors, please comment them below so that I can improve.
Sources
All the materials (i.e., functions like ta.rsi, etc...) used in here are available in the platform.
All the references or sources materials are commented with the code since the I am not allowed to put them here.

Variety RSI w/ Fibonacci Auto Channel [Loxx]Variety RSI w/ Fibonacci Auto Channel is an RSI indicator with 7 different RSI types and 4 Fibonacci Channels. This indicator has signal crossing options for signal, middle, and all Fibonacci levels. Bar and fill coloring is using a signal-determinant gradient coloring system to show signal strength or weakness.
What is RSI?
The relative strength index (RSI) is a momentum indicator used in technical analysis. RSI measures the speed and magnitude of a security's recent price changes to evaluate overvalued or undervalued conditions in the price of that security.
The RSI is displayed as an oscillator (a line graph) on a scale of zero to 100. The indicator was developed by J. Welles Wilder Jr. and introduced in his seminal 1978 book, New Concepts in Technical Trading Systems.
The RSI can do more than point to overbought and oversold securities. It can also indicate securities that may be primed for a trend reversal or corrective pullback in price. It can signal when to buy and sell. Traditionally, an RSI reading of 70 or above indicates an overbought situation. A reading of 30 or below indicates an oversold condition.
Included
Bar coloring
6 types of signal crossing options
Alerts
Loxx's Expanded Source Types
Loxx's RSI Variety RSI types
Options Strategy V2.0📈 Options Strategy V2.0 – Intraday Reversal-Resilient Momentum System
Overview:
This strategy is designed specifically for intraday SPY, TSLA, MSFT, etc. options trading (0DTE or 1DTE), using high-probability signals derived from a confluence of technical indicators: EMA crossovers, RSI thresholds, ATR-based risk control, and volume spikes. The strategy aims to capture strong directional moves while avoiding overtrading, thanks to a built-in cooldown logic and optional time/session filters.
⚙️ Core Concept
The strategy executes trades only in the direction of the prevailing trend, determined by short- and long-term Exponential Moving Averages (EMA). Entry signals are generated when the Relative Strength Index (RSI) confirms momentum in the direction of the trend, and volume spikes suggest institutional activity.
To increase adaptability and user control, it includes a highly customizable parameter set for both long and short entries independently.
📌 Key Features
✅ Trend-Following Logic
Long entries are only allowed when EMA(short) > EMA(long)
Short entries are only allowed when EMA(short) < EMA(long)
✅ RSI Confirmation
Long: Requires RSI crossover above a configurable threshold
Short: Requires RSI crossunder below a configurable threshold
Optional rejection filters: Entry blocked above/below specific RSI extremes
✅ Volume Spike Filter
Confirms institutional participation by comparing current volume to an average multiplied by a user-defined factor.
✅ ATR-Based Risk Management
Both Stop Loss (SL) and Take Profit (TP) are dynamically calculated using ATR × a multiplier.
TP/SL ratio is fully configurable.
✅ Cooldown Control
After every trade, the system waits for a set number of bars before allowing new entries.
This prevents overtrading and increases signal quality.
Optionally, cooldown is ignored for reversal trades, ensuring the system can react immediately to a confirmed trend change.
✅ Candle Body Filter (Noise Control)
Avoids trades on candles with too small bodies relative to wicks (often noise or indecision candles).
✅ VWAP Confirmation (Optional)
Ensures price is trading above VWAP for long entries, or below for short entries.
✅ Time & Session Filters
Trades only during regular market hours (09:30–16:00 EST).
No-trade zone (e.g., 14:15–15:45 EST) to avoid low-liquidity traps or late-day whipsaws.
✅ End-of-Day Auto Close
All open positions are force-closed at 15:55 EST, protecting against overnight risk (especially relevant for 0DTE options).
📊 Visual Aids
EMA plots show trend direction
VWAP line provides real-time mean-reversion context
Stop Loss and Take Profit lines appear dynamically with each trade
Alerts notify of entry signals and exit triggers
🔧 Customization Panel
Nearly every element of the strategy can be tailored:
EMA lengths (short and long, for both sides)
RSI thresholds and length
ATR length, SL multiplier, and TP/SL ratio
Volume spike sensitivity
Minimum EMA distance filter
Candle body ratio filter
Session restrictions
Cooldown logic (duration + reversal exception)
This makes the strategy extremely versatile, allowing both conservative and aggressive configurations depending on the trader’s profile and the market context.
📌 Example Use Case: SPY Options (0DTE or 1DTE)
This system was designed and tested specifically for SPY and other intraday options trading, where:
Delta is around 0.50 or higher
Trades are short-lived (often 1–5 candles)
You aim to trade 1–3 signals per day, filtering out weak entries
🚫 Important Notes
It is not a scalping strategy; it relies on confirmed breakouts with trend support
No pyramiding or re-entries without cooldown to preserve risk integrity
Should be used with real-time alerts and manual broker execution
📈 Alerts Included
📈 Long Entry Signal
📉 Short Entry Signal
⚠️ Auto-closed all positions at 15:55 EST
✅ Proven Settings – Real Trades + Backtest Results
The current version of the strategy includes the optimal settings I’ve arrived at through extensive backtesting, as well as 3 months of real trading with consistent profitability. These results reflect real-world execution under live market conditions using 0DTE SPY options, with disciplined trade management and risk control.
🧠 Final Thoughts
Options Strategy V2.0 is a robust, highly tunable intraday strategy that blends momentum, trend-following, and volume confirmation. It is ideal for disciplined traders focused on SPY or other 0DTE/1DTE options, and it includes guardrails to reduce false signals and improve execution timing.
Perfect for those who seek precision, flexibility, and risk-defined setups—not blind automation.
